|
|
Post by trubble on Apr 12, 2009 17:01:35 GMT
That was what Lin asked about, the past ten years. Don't blame everything on me because you hate me you mad mod.
|
|
|
|
Post by Alpha Hooligan on Apr 12, 2009 17:05:54 GMT
Yes, we humans are really leading the charge with our "Evilhouse Gasses" aren't we...  Tell it to the oceans and volcanos, the real culprits (if we are to belive that Evilhouse gasses are mussing up the planet...) AH |
|
|
|
Post by Alpha Hooligan on Apr 12, 2009 17:07:29 GMT
That was what Lin asked about, the past ten years. Don't blame everything on me because you hate me you mad mod. I don't hate you, I love you dearly, I just can't allow you to be brainwashed by this evil cult, if I have to abduct you and deprogram you, then so be it! You will thank me eventually.  AH |
|
|
|
Post by Deleted on Apr 12, 2009 17:40:30 GMT
I've had a hectic day and just downed two glasses of wine.... but if you compare the chart in my second link (it won't let me cut and paste) with the Holocene Maximum one provided by Alpha, it looks as if we have seen a bigger temperature rise since 1880 than happened over the course of 12,000 years. No doubt you will all be too polite to point out that I've misread the whole thing, and I will awake in the morning with one of those  moments. |
|
|
|
Post by trubble on Apr 12, 2009 17:51:42 GMT
That was what Lin asked about, the past ten years. Don't blame everything on me because you hate me you mad mod. I don't hate you, I love you dearly, I just can't allow you to be brainwashed by this evil cult, if I have to abduct you and deprogram you, then so be it! You will thank me eventually. AH Lin, could you please arrange for this to be archived as evidence if I ever go missing. |
|
|
|
Post by trubble on Apr 12, 2009 19:52:07 GMT
Yes, we humans are really leading the charge with our "Evilhouse Gasses" aren't we... Tell it to the oceans and volcanos, the real culprits (if we are to belive that Evilhouse gasses are mussing up the planet...) AH er..that is clearly a liar of a pie chart. Zero contributions from man? Man is not producing ANY greenhouse gases? Anyway, what you are skimming over in your assessment of Climate Change is the word change. Water Vapour is now and has been for a long time (forever?) the main cause of the greenhouse effect and its fluctuations have been balanced out naturally to keep it within certain measurements for thousands of years. A piece of luck or God's doing (whichever is your thang) that makes life sustainable. We are currently experiencing higher amounts than ever measured (measurements from ice going back thousands of years). That is a change from the normal fluctuation. So what has changed? More volcanoes? More clouds? The change coincides with the industrial revolution. Ho hum, these coinskidenkes are amazing, aren't they. So your pie-chart might be nearly right - if this was 7000BC it might be wholly right, if this was 1000AD it might be wholly right... but as you know, in ecology, one small change can have dramatic effects. Your pie chart should include that change even if it's only 0.2% of a contributing factor. |
|
|
|
Post by Alpha Hooligan on Apr 12, 2009 19:58:25 GMT
Look closely, we are responsible for approx 0.28% of carbon emissions.
Nobody doubts climate change is happening, just that it is "man made" and that raising the tax on everything will somehow reverse any alleged damage done by the tiny amounts that we produce.
AH
|
|
|
|
Post by Alpha Hooligan on Apr 12, 2009 20:10:06 GMT
Carbon emission fall into line with solar activity, more heat, more carbon (unless you believe the reverse that carbon release on earth somehow effects the Sun). Solar Activity - Carbon Levels 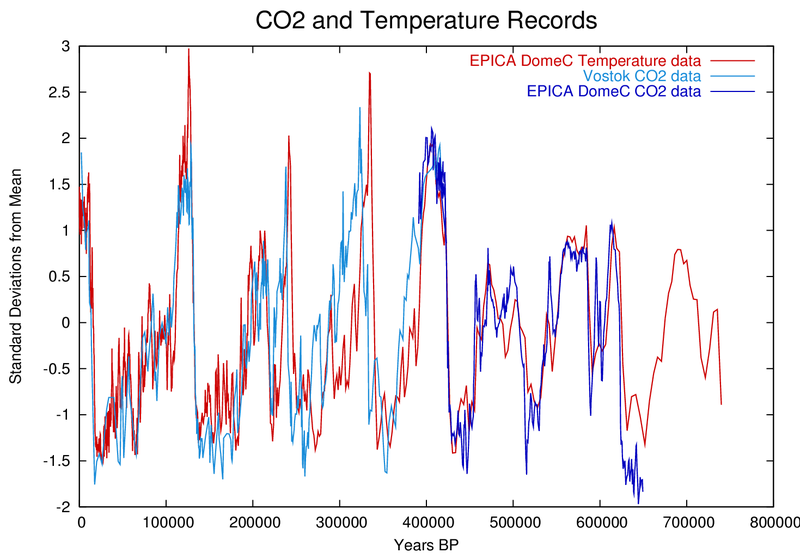 AH |
|
|
|
Post by Alpha Hooligan on Apr 12, 2009 20:11:39 GMT
(note: BIG picture over TENS of THOUSANDS of years, not teensy weensy tiny microdot pic of last few decades). ;D
AH
|
|
|
|
Post by trubble on Apr 12, 2009 20:33:55 GMT
Look even more closely, that's not what the pie chart says.
It's bad pie!!!!
|
|
|
|
Post by trubble on Apr 12, 2009 20:36:05 GMT
Carbon emission fall into line with solar activity, more heat, more carbon (unless you believe the reverse that carbon release on earth somehow effects the Sun). Solar Activity - Carbon Levels AH I don't know what that chart means. It just says that CO2 and temperature are partnered. You are no Sandy.  |
|
|
|
Post by trubble on Apr 12, 2009 20:37:06 GMT
(note: BIG picture over TENS of THOUSANDS of years, not teensy weensy tiny microdot pic of last few decades). ;D AH I have been talking about thousands of years. Don't just look at the pictures, read my fine words.  |
|
|
|
Post by trubble on Apr 12, 2009 20:39:33 GMT
Look even more closely, that's not what the pie chart says. It's bad pie!!!! Oh feckit anyway, you're right. ;D |
|
|
|
Post by trubble on Apr 12, 2009 20:41:00 GMT
So back to my point about change.
When did man start making all these gases and when did the temperatures start acting differently to the previous thousands of years?
If it's roughly the same time, should we consider a possible link?
|
|
|
|
Post by motorist on Apr 12, 2009 20:56:09 GMT
Links to what? Aliens eating beans? Skylark, I think you misunderstood my post ;D
|
|
|
|
Post by motorist on Apr 12, 2009 20:59:13 GMT
Zero contributions from man? Man is not producing ANY greenhouse gases? If you look closely there is a very thin blue line to the right of the green wedge |
|
|
|
Post by Alpha Hooligan on Apr 12, 2009 21:12:59 GMT
So back to my point about change. When did man start making all these gases and when did the temperatures start acting differently to the previous thousands of years? If it's roughly the same time, should we consider a possible link? We were'nt producing these gasses in 100.000BC, we were'nt producing them in 500AD...yet, according to the evidence presented by the fosil record, they are present in both those timeframes...at roughly the same time as sun went through violent activity... It's really flipping simple... Increased Solar activity = increased global temps and carbon levels. AH |
|
|
|
Post by Alpha Hooligan on Apr 12, 2009 21:13:24 GMT
...and the pie never lies!  AH |
|
|
|
Post by Alpha Hooligan on Apr 12, 2009 21:18:50 GMT
I don't know what that chart means. It just says that CO2 and temperature are partnered. You are no Sandy. Yes, partnered for the past 100.000 years! A long and happy relationship that will not be destroyed by squawking MMGW alarmists and shiesters out to tax you until you bleed white. (and no, I'm no Sandy, lovely bloke he may be, but he's totally deluded with odd Gaiarist/tree molesting tendencies). AH |
|
|
|
Post by Big Lin on Apr 12, 2009 21:47:21 GMT
The gases have been around for THOUSANDS of years and the temperatures have gone up and down throughout that time.
100,000 years ago we had massively hot periods; we had several Ice Ages (the most recent ended about 10,000 years ago); the temperature was hotter under the ancient Egyptians, the Roman times, around 500 AD, and between 1100-1500 AD.
It's also a fact that the HOTTEST years in the 20th century (except for the El Nino aberration) coincided with the LOWEST periods of CO2 emissions.
There IS an exact and unvarying relationship between solar activity and global temperatures; there is an inexact and variable relationship between CO2 emissions and global temperatures.
Those are scientific FACTS and I'm still waiting for answers to my questions.
So far Skylark has only attempted to answer ONE of my points.
I'm not some moron who doesn't think we should be ecologically minded and try to harvest and steward our resources rather than blindly exploit them.
On the other hand, the same 'experts' who were CERTAIN in the 1960s, 1970s and early 1980s that we were heading for a new Ice Age were wrong. So too are the global warming 'experts.'
Far too many of these claims have NOTHING to do with science and EVERYTHING to do with ideology.
|
|


 You can't see Canada across lake Erie, but you know it's there.
  It's the same with spring. You have to have faith, especially in Dublin. ~


 moments.


 ....I've updated the news scroll, at the top. Those are all clickable links to fresh current discussions. PLEASE JOIN IN!